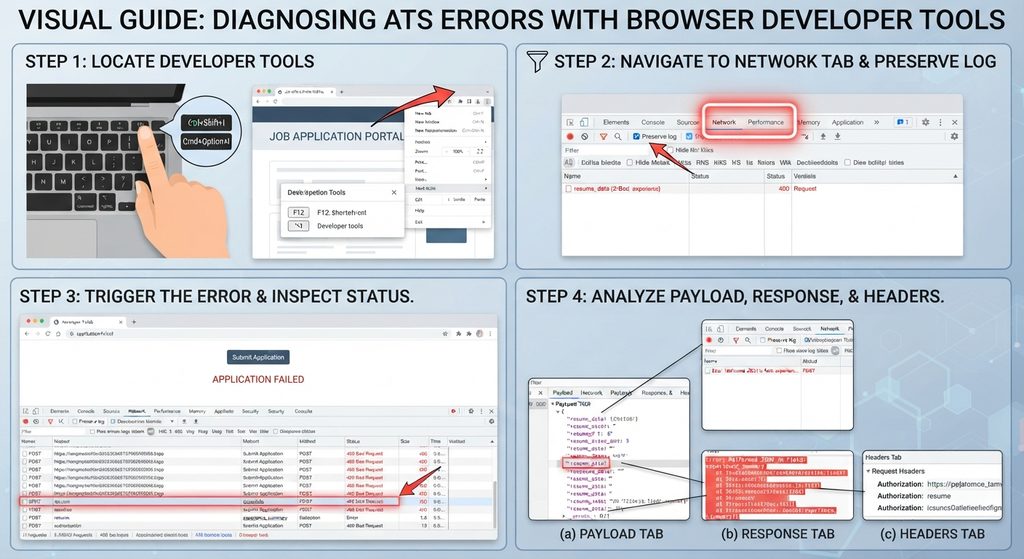
To diagnose technical glitches, broken form submissions, or application errors in an Applicant Tracking System (ATS), web browsers like Chrome, Firefox, or Edge feature built-in Developer Tools (accessible via F12 or Ctrl+Shift+I on Windows/Linux, and Cmd+Option+I on Mac).
The Network Tab provides a detailed record of every communication between your browser and the job application server. Key sections and data points to inspect include:
- HTTP Status Codes (The ‘Status’ Column): Look at the numbers returned when you submit an application or upload a resume.
- 200 OK: The request succeeded normally.
- 400 Bad Request or 422 Unprocessable Entity: The server rejected your data because the payload was formatted incorrectly or failed validation.
- 401 Unauthorized or 403 Forbidden: Authentication or session token issues (often caused by expired login tokens or strict cookie blockers).
- 500 Internal Server Error or 502 Bad Gateway: The application platform itself crashed on the backend.
- Request Payload Tab: When you click on an individual network request (like a form submission or resume upload), look at the Payload sub-tab. This shows the exact data (JSON or form-data) your browser sent to the server. Use this to verify whether your text inputs, resume file fields, or metadata were transmitted cleanly or if data fields were stripped out.
- Response Tab: Inspect what the server sent back after your request. Often, even if a page shows a generic “An error occurred” message, the Response tab will contain the exact system error log, stack trace, or text explanation sent by the platform’s database.
- Headers Tab: Shows request metadata, security policies, cookies, and user-agent details. This helps verify if your browser is successfully passing security tokens or if security extensions (like strict VPN policies or tracking blockers) are stripping crucial authorization headers.
- Preserve Log Checkbox: Always check this box at the top of the Network panel. It stops the tool from clearing data when a page refreshes or redirects, allowing you to catch quick error codes during multi-step application submissions.
Verification: You will know this step is successful when you isolate a specific red-highlighted network request returning a failing status code (like a 400 or 500) alongside an error payload that pinpoints whether the failure is a local browser block or a remote server bug.